Upgrade & Secure Your Future with DevOps, SRE, DevSecOps, MLOps!
We spend hours on Instagram and YouTube and waste money on coffee and fast food, but won’t spend 30 minutes a day learning skills to boost our careers.
Master in DevOps, SRE, DevSecOps & MLOps!
Learn from Guru Rajesh Kumar and double your salary in just one year.
Amazon Web Services (AWS) integrates DevOps principles into its monitoring and observability services to enhance system performance and reliability. By leveraging tools such as Amazon CloudWatch, AWS X-Ray, and Amazon CloudTrail, AWS enables continuous monitoring, real-time insights, and efficient debugging of applications and infrastructure. This integration facilitates proactive issue detection, streamlined operations, and improved collaboration between development and operations teams, embodying the core tenets of DevOps within AWS’s cloud environment. Below is an in-depth look at some of the key AWS services that exemplify this integration:
Amazon CloudWatch
Amazon CloudWatch is a versatile monitoring and observability service tailored for DevOps engineers, developers, site reliability engineers, and IT managers. It aggregates monitoring and operational data in the form of logs, metrics, and events, offering a unified perspective of AWS resources, applications, and services operating both on AWS and on-premises environments. This holistic view empowers teams to monitor application health, respond proactively to system-wide performance variations, and optimize resource utilization. Key features include:
- Comprehensive Data Collection: CloudWatch gathers extensive data from various AWS services, including Amazon EC2 instances, DynamoDB tables, and RDS DB instances, as well as custom metrics from applications.
- Real-Time Monitoring and Alarming: Users can set up alarms to monitor specific metrics and receive notifications or initiate automated actions when thresholds are breached, ensuring timely responses to potential issues.
- Log Management: With CloudWatch Logs, teams can collect, monitor, and analyze log files from AWS services and on-premises resources, facilitating troubleshooting and ensuring system integrity.
- Dashboards and Visualization: Customizable dashboards provide visual insights into operational data, enabling teams to track performance metrics and system health at a glance.
By leveraging these capabilities, organizations can maintain high availability and performance of their applications, aligning with DevOps best practices.
AWS X-Ray
AWS X-Ray is a powerful tool that aids developers in analyzing and debugging production and distributed applications, particularly those built using microservices architecture. It offers an end-to-end view of requests as they traverse through applications, mapping out the underlying components and their interactions. This comprehensive visibility is crucial for identifying performance bottlenecks and diagnosing errors. Notable features include:
- Distributed Tracing: X-Ray traces user requests across various services, providing a detailed view of the call paths and interactions within the application.
- Performance Analysis: By highlighting latency distributions and identifying slow components, X-Ray helps in pinpointing performance issues that may affect user experience.
- Error Detection: It captures exceptions and errors, allowing teams to quickly identify and address faults within the application stack.
- Service Map Visualization: X-Ray generates a dynamic service map that illustrates the relationships and data flow between application components, aiding in understanding complex architectures.
Integrating X-Ray into the development and production environment enables teams to gain actionable insights, ensuring applications run smoothly and efficiently.
Amazon Managed Grafana
Developed in collaboration with Grafana Labs, Amazon Managed Grafana is a fully managed service that streamlines the provisioning, setup, scaling, and maintenance of Grafana servers. Grafana is renowned for its robust data visualization capabilities, and this managed service enhances its accessibility and scalability. Key aspects include:
- Scalable and Secure Visualization: The service offers scalable, secure, and highly available data visualization for operational metrics, ensuring reliability and performance.
- Unified Observability: It enables querying, visualization, and alerting across multiple data sources, including metrics, logs, and traces, providing a comprehensive observability solution.
- Integration with AWS Services: Seamless integration with AWS services such as CloudWatch, X-Ray, and others allows for enriched data analysis and visualization.
- Enhanced Security Features: Features like single sign-on (SSO) support and fine-grained access control ensure that data remains secure and accessible to authorized users.
By utilizing Amazon Managed Grafana, organizations can create insightful dashboards that facilitate real-time monitoring and decision-making, aligning with DevOps objectives of continuous feedback and improvement.
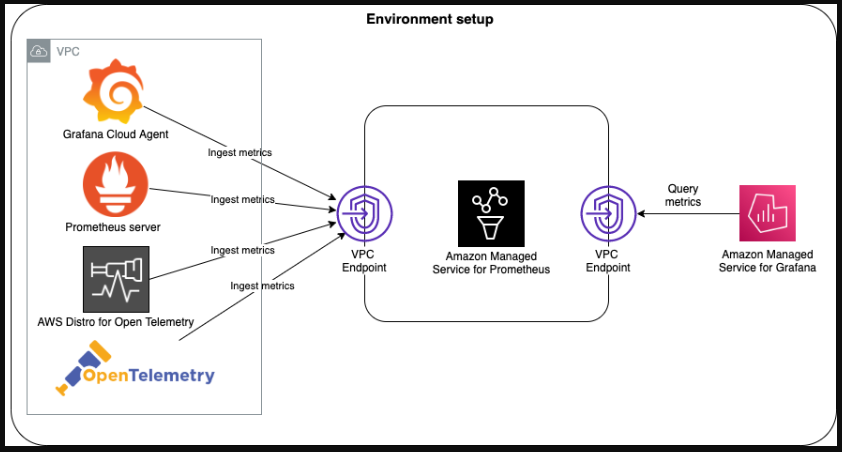
Amazon Managed Service for Prometheus
Amazon Managed Service for Prometheus is a fully managed, Prometheus-compatible service designed to ingest, store, and query metrics from containerized environments securely. Prometheus is a widely adopted open-source monitoring solution, and this managed service extends its capabilities with AWS’s scalability and security. Key features include:
- Seamless Integration with Kubernetes: The service integrates effortlessly with Amazon Elastic Kubernetes Service (EKS) and other Kubernetes environments, facilitating the monitoring of containerized applications.
- Scalable Data Collection: It automatically scales to accommodate varying workloads, ensuring consistent performance without manual intervention.
- Secure and Managed Environment: AWS handles the operational aspects, including patching, scaling, and maintenance, while implementing robust security measures to protect data.
- Compatibility with PromQL: Users can leverage the Prometheus Query Language (PromQL) to perform flexible and powerful queries on the collected metrics.
This service enables DevOps teams to monitor the performance of their containerized workloads effectively, ensuring that applications remain responsive and reliable.
AWS CloudTrail
AWS CloudTrail enhances observability by providing a comprehensive event history of AWS API activity, including actions taken through the AWS Management Console, SDKs, command-line tools, and other AWS services. This detailed logging is instrumental for security analysis, compliance auditing, and operational troubleshooting. Key functionalities include:
- Comprehensive Event Logging: CloudTrail records all API calls and related events within an AWS account, offering a complete audit trail of user and service activities.
- Centralized Log Management: Logs can be centralized across multiple accounts and regions, simplifying analysis and compliance reporting.