
 Starting: 1st of Every Month
  +91 8409492687 |
  Contact@DevOpsSchool.com
Upgrade & Secure Your Future with DevOps, SRE, DevSecOps, MLOps!
We spend hours on Instagram and YouTube and waste money on coffee and fast food, but won’t spend 30 minutes a day learning skills to boost our careers.
Master in DevOps, SRE, DevSecOps & MLOps!
Learn from Guru Rajesh Kumar and double your salary in just one year.
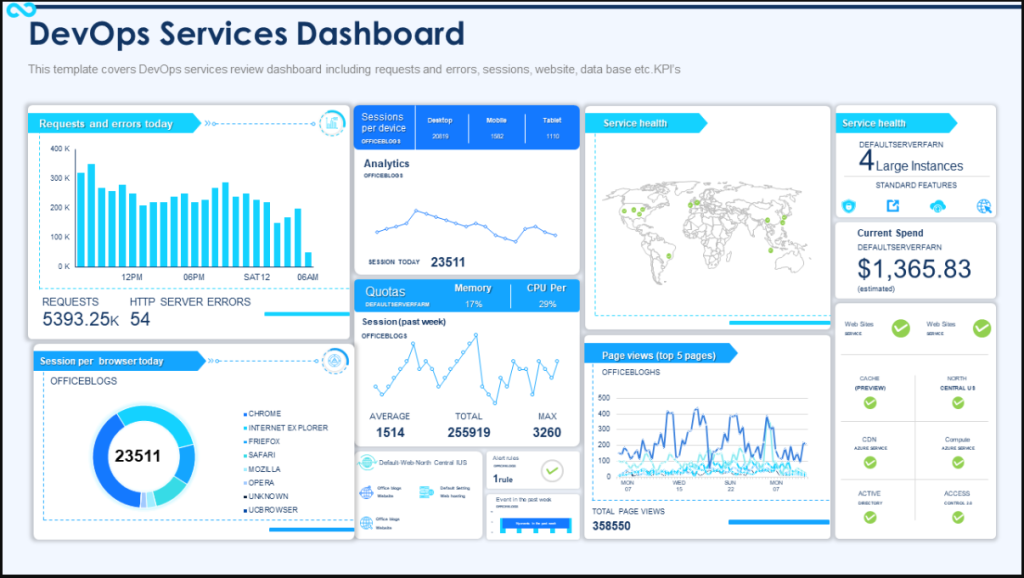
A DevOps dashboard is a visual representation of key metrics, data, and KPIs (Key Performance Indicators) that allow teams to track the performance of their applications, infrastructure, and DevOps processes. These dashboards provide insights into the health of the system, streamline communication between development, operations, and business teams, and help organizations make data-driven decisions.
Building a DevOps dashboard involves selecting the right metrics to track, integrating various data sources, and ensuring that the dashboard is user-friendly and actionable. In this post, we will walk through the process of building a DevOps dashboard, focusing on its major features and how it can drive improvements in efficiency, monitoring, and decision-making.
Key Metrics to Include in a DevOps Dashboard
The first step in building a DevOps dashboard is to identify the key metrics and KPIs that will provide insights into the health of the system. These metrics vary depending on the organization’s goals, but there are several common metrics that most DevOps teams should monitor.
Key Metrics to Include:
- Deployment Frequency: Track how often new code is deployed to production. This helps measure the speed and frequency of releases, indicating the efficiency of your CI/CD pipeline.
- Lead Time for Changes: This metric measures the time it takes from writing code to deploying it to production. A shorter lead time indicates faster development cycles and improved efficiency.
- Mean Time to Recovery (MTTR): MTTR measures the time it takes to recover from a failure. Lower MTTR values reflect the agility of the team in addressing issues.
- Change Failure Rate: This metric tracks the percentage of deployments that result in failures. A high change failure rate may indicate the need for better testing or deployment practices.
- Application Performance Metrics: Include data on response times, error rates, and system availability to assess how well applications are performing in production.
- Infrastructure Metrics: Track metrics such as server uptime, resource utilization, and network performance to ensure that the underlying infrastructure is healthy.
Choosing the Right Tools for Building a DevOps Dashboard
Building a DevOps dashboard requires selecting the right tools for gathering data, processing it, and visualizing it in a way that is actionable for your teams. Several tools are available that can help automate this process, depending on your tech stack and requirements.
Tools for Building a DevOps Dashboard:
- Grafana: A popular open-source visualization tool, Grafana allows you to create custom dashboards that integrate with various data sources, including Prometheus, Elasticsearch, and others. It is well-suited for monitoring infrastructure and application performance.
- Kibana: Kibana, part of the Elastic Stack, provides powerful visualization capabilities for analyzing log data from applications and infrastructure. It is great for aggregating and visualizing logs, performance metrics, and application traces.
- Datadog: Datadog is a cloud-based monitoring platform that offers easy integration with a wide range of services, providing real-time visibility into application and infrastructure performance. It supports log management, APM, and monitoring metrics.
- Jenkins: Jenkins, often used for continuous integration, can be integrated with dashboard tools to display build and deployment metrics. It is useful for monitoring CI/CD pipeline performance.
- Prometheus: Prometheus is an open-source system monitoring and alerting toolkit that works well with Grafana to collect and visualize time-series data, making it ideal for tracking application and infrastructure metrics.
Building the DevOps Dashboard: Steps to Follow
Now that you have a clear understanding of the metrics to include and the tools to use, let’s walk through the steps of building your DevOps dashboard.
Steps for Building the Dashboard:
- Define the Purpose of the Dashboard: The first step is to define the objective of the dashboard. Are you tracking development speed? Monitoring infrastructure? Measuring application performance? Identifying the goal will help you decide which metrics to include.
- Choose the Right Data Sources: Once you know what you want to track, choose the data sources that provide the information you need. This could be source control repositories, CI/CD pipelines, log management tools, cloud infrastructure, or application performance monitoring systems.
- Select the Dashboard Tool: Pick the appropriate tool for building the dashboard. Based on your organization’s tech stack and specific needs, tools like Grafana, Datadog, or Kibana might be ideal for visualizing your chosen metrics.
- Integrate Data Sources with the Dashboard Tool: Once the tool is selected, integrate your data sources. This typically involves connecting APIs or installing data shippers to pull the required metrics from various systems like Jenkins, Kubernetes, Prometheus, etc.
- Design and Customize the Dashboard: Create a dashboard layout that is easy to understand. Use different visualization formats (e.g., graphs, heatmaps, pie charts) to display the metrics clearly. Organize metrics into categories like “Build Pipeline”, “Application Performance”, and “Infrastructure Health” for easy navigation.
- Set Alerts and Automate Reports: Set up automated alerts to notify team members when certain thresholds are crossed, such as slow response times or deployment failures. Automating report generation can provide stakeholders with regular updates without manual intervention.
Best Practices for DevOps Dashboard Design
Creating a DevOps dashboard is not just about collecting data; it’s about making that data actionable. A well-designed dashboard ensures that the information is clear, concise, and easy to understand at a glance.
Best Practices for Dashboard Design:
- Keep it Simple and Focused: Avoid cluttering the dashboard with too many metrics. Focus on the most critical KPIs that directly impact the success of your DevOps practices.
- Use Clear Visualizations: Use graphs, charts, and color-coded indicators (e.g., green for healthy, red for problematic) to present data in an easily digestible format. This makes it quicker for teams to identify issues and take action.
- Ensure Real-Time Data: DevOps dashboards should provide real-time or near-real-time data so that teams can react quickly to changes and issues in the system.
- Make it Customizable: Allow different users (e.g., developers, operations teams, business leaders) to customize their view of the dashboard. Different stakeholders will need different information, so flexibility is key.
- Ensure Responsiveness: A good dashboard should be accessible across devices, whether on desktop or mobile. Ensure that the dashboard is responsive and that the key metrics are always accessible, even on smaller screens.
Benefits of a DevOps Dashboard
Building a DevOps dashboard brings a range of benefits that can help teams improve the efficiency and effectiveness of their development and operations processes.
Key Benefits of a DevOps Dashboard:
- Increased Visibility: A DevOps dashboard gives all stakeholders (development, operations, business teams) real-time access to system performance, enabling them to stay informed and make timely decisions.
- Faster Issue Detection: With a DevOps dashboard in place, teams can quickly identify problems such as deployment failures, slow response times, or infrastructure issues. This allows for rapid issue resolution and minimal downtime.
- Improved Collaboration: By providing a shared view of system health and performance, DevOps dashboards promote collaboration between development and operations teams. It aligns teams on performance goals and fosters data-driven decision-making.
- Enhanced Decision-Making: With data visualized in a clear and accessible way, stakeholders can make better, more informed decisions about the development lifecycle, resource allocation, and troubleshooting efforts.
- Continuous Improvement: Monitoring KPIs through a DevOps dashboard allows teams to continuously measure and improve processes, from development speed to application stability, and optimize their workflows for better results.
The Power of a DevOps Dashboard
Building a DevOps dashboard is a crucial step toward enhancing transparency, efficiency, and collaboration within development and operations teams. By selecting the right metrics, using the right tools, and designing an actionable and user-friendly dashboard, teams can significantly improve their ability to monitor, track, and optimize system performance.
With a DevOps dashboard in place, organizations can achieve faster issue resolution, more informed decision-making, and ultimately deliver higher-quality software more efficiently. By continuously monitoring KPIs and driving improvements based on the insights provided, a DevOps dashboard is an invaluable tool in the journey toward operational excellence.