
 Starting: 1st of Every Month
  +91 8409492687 |
  Contact@DevOpsSchool.com
Upgrade & Secure Your Future with DevOps, SRE, DevSecOps, MLOps!
We spend hours on Instagram and YouTube and waste money on coffee and fast food, but won’t spend 30 minutes a day learning skills to boost our careers.
Master in DevOps, SRE, DevSecOps & MLOps!
Learn from Guru Rajesh Kumar and double your salary in just one year.
Elastic incorporates DevOps principles in monitoring and observability by providing a comprehensive solution through its Elastic Stack (ELK Stack), which includes Elasticsearch, Logstash, Kibana, and Beats. These tools enable DevOps teams to centralize logging, collect and analyze system metrics, and visualize application performance data in real time, making it easier to monitor the health of applications and infrastructure. Elastic also supports distributed tracing via Elastic APM, allowing teams to track the performance of microservices and identify bottlenecks. Additionally, it integrates alerting mechanisms, which notify teams of critical issues based on predefined thresholds, enabling quick responses and automating workflows. By centralizing observability data and enabling real-time analysis, Elastic empowers DevOps teams to proactively detect, troubleshoot, and resolve issues across complex environments, enhancing system reliability and performance.
Introduction to DevOps in Monitoring and Observability
Elastic, a popular open-source software company, integrates DevOps practices into its monitoring and observability tools to provide real-time insights into complex systems. By adopting DevOps principles, Elastic enables organizations to optimize performance, troubleshoot issues, and ensure seamless service delivery. Monitoring and observability have become integral components in modern IT operations, and Elastic’s suite of tools is designed to make this process more efficient.
What is Elastic’s Role in DevOps Monitoring?
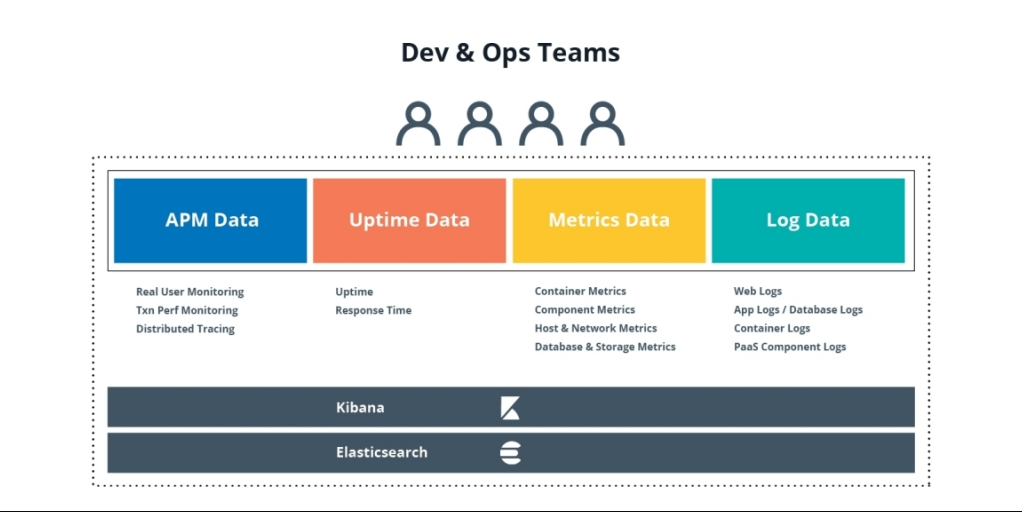
Elastic plays a crucial role in empowering DevOps teams with tools that allow them to monitor their systems efficiently. The Elastic Stack (also known as the ELK Stack) comprises four main components: Elasticsearch, Logstash, Kibana, and Beats. These components are integrated into a unified solution that provides centralized monitoring, log management, and observability. Elastic is known for making it easier for teams to collect, process, analyze, and visualize the performance and behavior of applications, infrastructure, and networks in real-time.
Key Elements of Elastic’s Role in DevOps:
- Centralized Logging and Monitoring: One of the core features of Elastic’s monitoring capabilities is the ability to centralize logs and metrics. By collecting data from various sources into one platform, Elastic ensures that teams can easily access the information they need for troubleshooting and performance analysis. This centralized approach simplifies workflows and enhances collaboration among different teams in the DevOps pipeline.
- Distributed Tracing for Microservices: With the rise of microservices architectures, distributed tracing has become essential for DevOps teams. Elastic’s APM (Application Performance Monitoring) tool includes built-in distributed tracing capabilities, enabling teams to track requests as they move across services. This is crucial for identifying bottlenecks and performance degradation in complex systems.
- Visual Dashboards with Kibana: Kibana, Elastic’s visualization tool, allows teams to create real-time dashboards that display key metrics and logs. These dashboards provide a comprehensive view of system health, allowing DevOps teams to make data-driven decisions quickly. Whether it’s monitoring system uptime, response times, or error rates, Kibana’s dashboards are a key part of Elastic’s monitoring capabilities.
- Elastic Beats: Lightweight data shippers like Elastic Beats allow DevOps teams to easily collect data from various sources, such as servers, applications, and databases. Beats send this data to Elasticsearch, where it can be indexed and analyzed in real-time.
Major Features of Elastic’s Monitoring and Observability
Elastic’s platform for monitoring and observability stands out due to several powerful features that make it a top choice for DevOps teams. These features not only enhance system performance but also provide the visibility needed to ensure a seamless user experience.
Key Features of Elastic’s Monitoring Tools:
- Unified Data Platform: One of the standout features of Elastic is its ability to integrate logs, metrics, and traces into a single platform. This unified approach ensures that DevOps teams don’t need to rely on multiple disparate tools for monitoring. Instead, they can track all relevant data from a single interface, streamlining their workflows and improving productivity.
- Scalability and Flexibility: Elastic’s platform is designed to scale as organizations grow. Whether your infrastructure consists of a few servers or spans across multiple regions and cloud environments, Elastic can handle the volume of data generated by modern systems. Elasticsearch, as the underlying search engine, is built for high performance and low latency, even when processing petabytes of data.
- AI-Powered Anomaly Detection: With the integration of machine learning, Elastic’s monitoring tools can automatically detect anomalies in real time. For instance, the system can spot unusual traffic patterns or spikes in error rates, alerting teams to potential issues before they escalate into critical failures. This proactive approach allows for faster remediation and less downtime.
- Security Monitoring and Compliance: Elastic integrates security capabilities into its monitoring and observability tools, allowing teams to not only track performance but also identify security threats. Elastic Security provides real-time threat detection and analysis, helping teams secure their applications and infrastructure while meeting compliance requirements.
- Customizable Dashboards: Kibana’s visualization features offer a wide range of customization options. DevOps teams can create dashboards that display exactly the data they need in the format that makes the most sense for their operations. Whether it’s graphs, tables, or heatmaps, Kibana can display a variety of metrics tailored to specific needs.
How Elastic APM Enhances DevOps Monitoring
Elastic APM is an integral part of the Elastic Stack and focuses specifically on application performance monitoring. By providing detailed insights into how applications perform in production, it plays a critical role in DevOps monitoring.
Features of Elastic APM:
- Real-Time Performance Tracking: Elastic APM tracks the performance of applications in real-time, allowing DevOps teams to understand how their systems are performing at any given moment. From frontend user interactions to backend database queries, APM provides a complete picture of application health.
- Error and Latency Detection: APM helps detect issues such as slow transactions, errors, and performance bottlenecks. By providing detailed information about these problems, teams can quickly pinpoint the root cause and implement fixes before users are impacted.
- Distributed Tracing: With Elastic APM, teams can trace requests as they move through the system, even across different services. This is especially useful in microservices architectures, where requests may span multiple services and databases. Distributed tracing helps DevOps teams identify where performance issues are originating and provides insights into potential fixes.
- Service Dependencies and Impact: Elastic APM also visualizes service dependencies, allowing teams to understand how different components of the system interact. This visualization helps identify critical services whose failure could impact the rest of the infrastructure.
Benefits of Elastic for DevOps Teams
Elastic provides several distinct benefits for DevOps teams that aim to achieve better monitoring, faster troubleshooting, and more reliable system performance.
Key Benefits Include:
- Faster Issue Resolution: With centralized logging, real-time dashboards, and detailed application performance insights, DevOps teams can resolve issues more quickly. Whether it’s a bug in the code or a hardware failure, Elastic’s tools provide the data necessary to troubleshoot and fix problems before they affect end-users.
- Improved System Reliability: By continuously monitoring system health and performance, Elastic helps teams proactively identify issues and prevent outages. The built-in anomaly detection and alerting features ensure that potential problems are addressed before they escalate, improving system uptime and reliability.
- Enhanced Collaboration: The centralized nature of Elastic’s platform makes it easier for DevOps, development, and operations teams to collaborate. Customizable dashboards, shared insights, and real-time data foster cross-team collaboration, enabling faster decision-making and problem resolution.
- Increased Efficiency: By consolidating multiple monitoring tasks into one unified platform, Elastic increases operational efficiency. DevOps teams no longer need to juggle multiple tools and interfaces, streamlining their workflows and enabling them to focus more on delivering value to end-users.
- Security and Compliance Monitoring: Elastic not only helps teams monitor system performance but also keeps an eye on security metrics. This ensures that applications and infrastructure are not only running smoothly but are also protected from potential threats and vulnerabilities.
How Elastic Supports Continuous Improvement in DevOps
Elastic’s monitoring and observability tools are not just about real-time issue resolution; they also support continuous improvement in DevOps practices by providing teams with continuous feedback and actionable insights.
How Elastic Drives Continuous Improvement:
- Constant Feedback Loops: By integrating monitoring into every stage of the development and deployment cycle, Elastic ensures that teams can access ongoing feedback. This constant loop allows DevOps teams to iterate quickly, making adjustments to improve performance, reliability, and security.
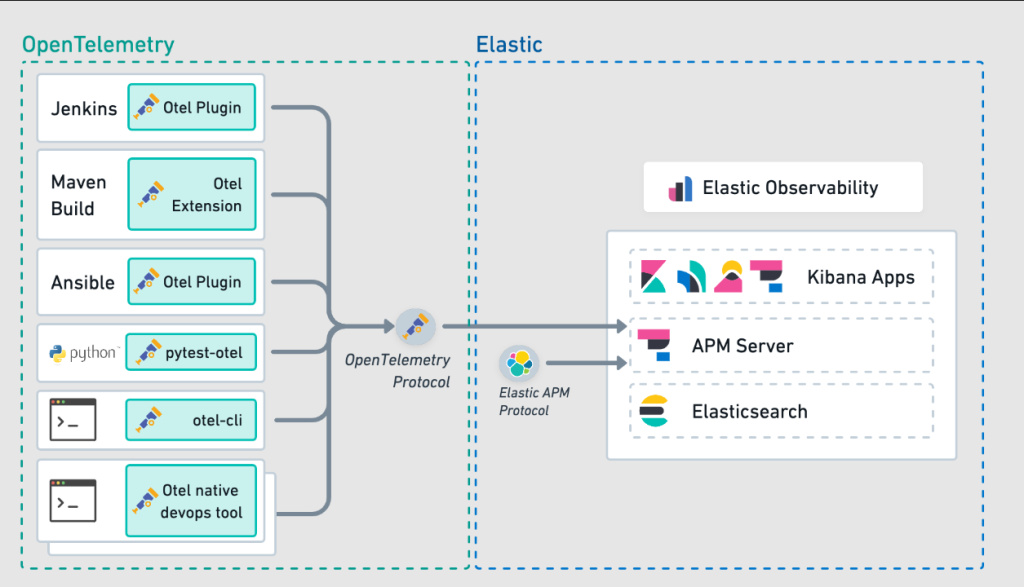
- CI/CD Integration: Elastic’s platform integrates seamlessly with CI/CD pipelines, ensuring that monitoring and observability are embedded throughout the software development process. This integration helps teams to maintain high-quality standards and to quickly identify issues during development and testing.
- Alerting and Incident Management: Elastic’s built-in alerting system allows teams to receive immediate notifications when performance deviates from expected parameters. These alerts are crucial for ensuring that problems are quickly addressed, reducing downtime and improving the speed at which issues are resolved.
Elastic’s Impact on DevOps Monitoring and Observability
Elastic’s suite of monitoring and observability tools offers DevOps teams a comprehensive, scalable, and flexible solution for ensuring the health and performance of their applications and infrastructure. From real-time monitoring and AI-driven insights to seamless integration with CI/CD pipelines, Elastic empowers teams to troubleshoot faster, collaborate more effectively, and ensure continuous improvement in system performance. As modern infrastructure becomes more complex, Elastic’s observability solutions provide the visibility and control that DevOps teams need to deliver reliable, high-performing applications.
By integrating Elastic’s monitoring and observability solutions into their DevOps workflows, teams can ensure that their systems are running optimally, identify potential issues before they escalate, and drive continuous improvement to meet the demands of today’s fast-paced IT landscape.