
 Starting: 1st of Every Month
  +91 8409492687 |
  Contact@DevOpsSchool.com
Upgrade & Secure Your Future with DevOps, SRE, DevSecOps, MLOps!
We spend hours on Instagram and YouTube and waste money on coffee and fast food, but won’t spend 30 minutes a day learning skills to boost our careers.
Master in DevOps, SRE, DevSecOps & MLOps!
Learn from Guru Rajesh Kumar and double your salary in just one year.
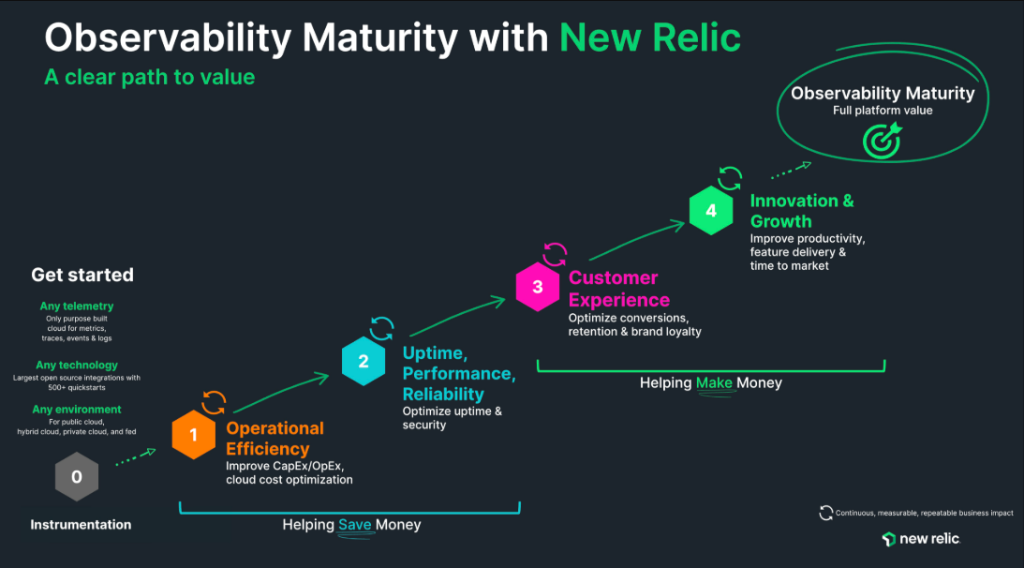
Introduction to New Relic’s Role in DevOps Monitoring and Observability
In today’s fast-paced software development environment, monitoring and observability are essential for maintaining system performance and identifying issues before they impact users. New Relic, a leader in observability, integrates DevOps principles into its suite of monitoring tools to help organizations achieve real-time visibility, faster troubleshooting, and improved system performance. With a strong focus on providing end-to-end monitoring capabilities, New Relic enables teams to monitor infrastructure, applications, and microservices in real-time, fostering a data-driven approach to DevOps.
By incorporating observability directly into the DevOps pipeline, New Relic empowers organizations to improve software reliability, optimize performance, and make informed decisions quickly. This post will explore how New Relic leverages DevOps practices for monitoring and observability, as well as the key features that make it a leading solution for modern DevOps teams.
How New Relic Implements DevOps in Monitoring
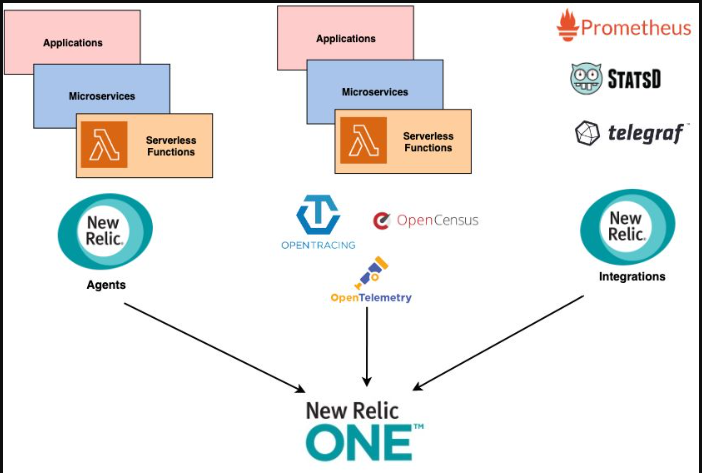
New Relic has built a robust monitoring and observability platform designed specifically for DevOps teams. The platform provides deep visibility into applications, infrastructure, and services, enabling teams to monitor the entire software lifecycle. New Relic integrates seamlessly with DevOps workflows to ensure that monitoring is embedded throughout development, deployment, and production processes.
Key Aspects of New Relic’s DevOps Monitoring:
- Unified Platform: New Relic combines application performance monitoring (APM), infrastructure monitoring, and real-time log analytics into a single platform, allowing DevOps teams to have a comprehensive view of their systems.
- Real-Time Data: New Relic continuously collects and analyzes data from all levels of the infrastructure, providing real-time insights into system performance and user experience. This data helps teams identify and address performance issues before they affect end-users.
- Distributed Tracing: New Relic provides detailed distributed tracing, enabling teams to visualize the path of requests across multiple services and components. This is essential for troubleshooting performance issues in complex microservices architectures.
- Integration with CI/CD Pipelines: New Relic’s monitoring tools integrate seamlessly with CI/CD pipelines, allowing teams to monitor application performance and stability throughout the development cycle. This ensures that performance issues are identified early in the process, reducing the risk of failures in production.
Major Features of New Relic’s Monitoring and Observability Tools
New Relic offers a comprehensive set of features that help DevOps teams monitor the performance of their applications, infrastructure, and services. These features make it easy to gain insights into system health and resolve issues quickly.
Key Features of New Relic:
- Application Performance Monitoring (APM): New Relic’s APM tool is one of the most widely used features in its platform. It provides detailed insights into application performance, identifying slow transactions, errors, and bottlenecks. APM helps DevOps teams understand how their applications perform and where improvements are needed.
- Infrastructure Monitoring: New Relic offers robust infrastructure monitoring, tracking key metrics such as server health, resource utilization, and service performance. It provides visibility into the health of cloud infrastructure, ensuring that DevOps teams can optimize resources and prevent outages.
- Distributed Tracing and End-to-End Visibility: Distributed tracing allows teams to trace requests as they move through different microservices, providing complete visibility into how requests are handled across the entire system. This feature is especially useful in identifying performance bottlenecks in distributed applications.
- Real-Time Log Analytics: New Relic’s log management tool helps teams collect, search, and analyze logs in real time. Logs are an invaluable source of information for troubleshooting, and New Relic makes it easy to correlate logs with performance data to identify and fix issues faster.
- Custom Dashboards and Alerts: New Relic allows teams to create custom dashboards that display the metrics that matter most to them. Alerts can be set up to notify teams when certain thresholds are exceeded, ensuring that performance issues are addressed immediately.
How New Relic Supports Proactive Issue Detection
New Relic’s monitoring and observability tools not only help detect issues in real time but also offer proactive monitoring features that help teams identify potential problems before they escalate. With machine learning-powered anomaly detection and predictive alerts, New Relic enables DevOps teams to stay ahead of performance issues and minimize downtime.
Features for Proactive Issue Detection:
- Anomaly Detection with AI: New Relic uses artificial intelligence (AI) and machine learning (ML) to detect abnormal behavior in applications and infrastructure. By analyzing patterns of performance data, the system can identify anomalies and send alerts before issues escalate.
- Automated Alerting: New Relic allows teams to configure automated alerts based on performance thresholds, such as response time, error rates, or resource usage. These alerts notify teams immediately when a problem arises, allowing for faster response times.
- Root Cause Analysis: New Relic’s deep visibility into application and infrastructure performance allows teams to quickly pinpoint the root cause of issues. By correlating metrics, logs, and traces, New Relic helps teams determine the exact cause of performance degradation and take corrective action.
- Proactive Scaling: New Relic’s infrastructure monitoring tools help teams identify underutilized or overutilized resources, allowing them to scale applications and infrastructure in a timely manner to meet demand. This proactive approach prevents system overloads and ensures optimal performance.
Benefits of Using New Relic for DevOps Monitoring
New Relic’s suite of monitoring and observability tools provides numerous benefits to DevOps teams, from faster troubleshooting to improved collaboration. By offering real-time insights and powerful diagnostics, New Relic helps teams maintain system health and ensure optimal performance.
Key Benefits of New Relic:
- Faster Issue Resolution: With real-time monitoring, distributed tracing, and detailed performance analytics, New Relic helps teams identify and resolve issues faster. This reduces downtime and ensures that users experience minimal disruption.
- Improved System Reliability: By continuously monitoring system health and performance, New Relic enables DevOps teams to proactively address potential issues. This reduces the risk of outages and improves the reliability of applications and infrastructure.
- Collaboration Across Teams: New Relic’s platform fosters collaboration among development, operations, and business teams. Custom dashboards and shared data insights ensure that all stakeholders have access to the information they need to make informed decisions and work together to resolve issues.
- Data-Driven Decisions: New Relic’s deep analytics capabilities allow teams to make data-driven decisions when optimizing their applications, infrastructure, and services. Whether it’s identifying performance bottlenecks or optimizing resource usage, New Relic provides the insights needed to drive continuous improvement.
- Cost Efficiency: With the ability to monitor infrastructure and applications in real time, New Relic helps teams identify inefficiencies and reduce costs. By optimizing resource utilization and detecting underperforming services, organizations can save on cloud infrastructure costs.
How New Relic Facilitates Continuous Improvement in DevOps
Continuous improvement is a core principle of DevOps, and New Relic’s monitoring tools play a key role in helping teams achieve this. By providing actionable insights, enabling automated responses, and integrating with CI/CD pipelines, New Relic helps teams iterate and improve their applications continuously.
Features for Continuous Improvement:
- CI/CD Integration: New Relic integrates seamlessly with CI/CD pipelines, providing visibility into application performance during development, testing, and production stages. This integration ensures that teams can monitor the impact of new code releases and make adjustments as needed.
- Continuous Feedback: New Relic provides continuous feedback through real-time monitoring, alerts, and detailed analytics. This feedback allows teams to make iterative improvements, whether it’s optimizing code, scaling infrastructure, or refining user experiences.
- Performance Optimization: New Relic’s performance monitoring tools help teams identify slow transactions, errors, and resource bottlenecks. By continuously optimizing applications, teams can improve performance and deliver better user experiences.
- Agile Monitoring: New Relic supports agile development by allowing teams to track the impact of changes over time. The ability to monitor performance during every sprint ensures that teams can quickly adapt to new requirements and fix issues before they reach production.
New Relic’s Impact on DevOps Monitoring and Observability
New Relic’s comprehensive suite of monitoring and observability tools plays a critical role in helping DevOps teams monitor, analyze, and optimize their applications and infrastructure. With real-time insights, powerful analytics, and proactive issue detection, New Relic empowers teams to deliver high-performance software and maintain system reliability. The platform’s seamless integration with CI/CD pipelines, customizable dashboards, and machine learning-driven anomaly detection ensure that DevOps teams can respond quickly, continuously improve, and make data-driven decisions that enhance application performance.
By leveraging New Relic’s observability capabilities, organizations can achieve greater visibility, reduce downtime, optimize resources, and ensure that their applications meet the highest standards of performance. Whether you are working on a small-scale application or managing a complex, distributed system, New Relic provides the tools you need to succeed in modern DevOps environments.