Upgrade & Secure Your Future with DevOps, SRE, DevSecOps, MLOps!
We spend hours on Instagram and YouTube and waste money on coffee and fast food, but won’t spend 30 minutes a day learning skills to boost our careers.
Master in DevOps, SRE, DevSecOps & MLOps!
Learn from Guru Rajesh Kumar and double your salary in just one year.
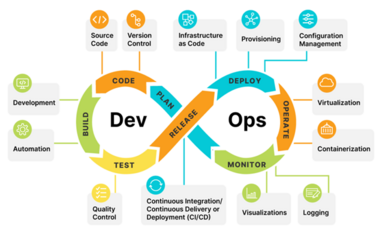
Log analysis is an essential part of modern DevOps practices. It involves the collection, analysis, and interpretation of log data generated by applications, systems, and infrastructure. Logs provide insights into system behavior, performance, and potential issues, which are crucial for maintaining reliability and performance in any environment.
In DevOps, where the focus is on continuous delivery, automation, and collaboration, log analysis plays a vital role in maintaining system health and identifying bottlenecks or failures before they affect end-users. This post explores how DevOps can enhance log analysis by using automation, real-time monitoring, and collaboration to improve operational efficiency and problem resolution.
Key Benefits of Using DevOps for Log Analysis
Integrating DevOps principles into log analysis allows organizations to make data-driven decisions, quickly identify problems, and improve system reliability. Here are the key benefits:
Key Benefits Include:
- Proactive Issue Detection:
- By continuously collecting and analyzing logs, DevOps teams can detect issues before they become critical problems.
- Logs provide early warning signs for application errors, system failures, and performance degradation, enabling faster response times.
- Improved Incident Resolution:
- When incidents occur, log analysis helps teams quickly pinpoint the root cause of the problem.
- Logs provide detailed insights into system events, allowing for quicker diagnosis and resolution, minimizing downtime.
- Enhanced System Monitoring:
- With DevOps, log analysis tools are integrated into continuous monitoring systems, allowing teams to get a real-time view of system health and performance.
- Continuous monitoring helps track metrics like error rates, latency, and traffic, providing a comprehensive view of the environment.
- Automated Alerts and Notifications:
- DevOps tools can automatically analyze logs for specific patterns or thresholds and send alerts when anomalies are detected.
- This automation ensures that issues are identified and addressed immediately, reducing the need for manual log review.
- Efficient Collaboration Across Teams:
- DevOps emphasizes collaboration between development, operations, and QA teams. Log analysis tools integrated with communication platforms (like Slack or Jira) enable seamless collaboration during troubleshooting and incident resolution.
- Teams can share insights and update each other in real-time, leading to quicker problem resolution.
Tools for Log Analysis in DevOps
DevOps relies on a range of tools to facilitate efficient log analysis, automate log aggregation, and provide actionable insights. These tools help teams manage vast amounts of log data generated across systems and applications.
Key Log Analysis Tools for DevOps:
- Elasticsearch, Logstash, and Kibana (ELK Stack):
- The ELK Stack is one of the most popular and powerful tools for log aggregation, search, and visualization.
- Logstash collects and parses log data, Elasticsearch indexes it for efficient searching, and Kibana provides a user-friendly interface for visualizing and analyzing the logs.
- The ELK Stack allows DevOps teams to easily search, filter, and visualize logs from multiple sources in real time.
- Splunk:
- Splunk is a widely used log management platform that collects, indexes, and analyzes machine data from applications and infrastructure.
- Splunk provides advanced search capabilities, real-time alerting, and dashboard visualizations, making it an essential tool for proactive log analysis in DevOps environments.
- Prometheus and Grafana:
- Prometheus is a monitoring tool that can collect logs and metrics from services and store them in a time-series database.
- Grafana integrates with Prometheus to visualize log and metric data, providing insights into system performance and anomalies.
- These tools are often used together to monitor logs and application metrics simultaneously, helping teams correlate data and identify trends.
- Datadog:
- Datadog is a cloud-based monitoring and analytics platform that includes powerful log management capabilities.
- It can collect, analyze, and visualize logs, as well as provide machine learning-driven anomaly detection and insights, improving system observability and incident detection.
- Fluentd:
- Fluentd is an open-source log collector that can aggregate logs from various sources and forward them to different storage solutions, such as Elasticsearch, Splunk, or cloud platforms.
- Fluentd is highly customizable, making it ideal for complex environments where logs need to be filtered, parsed, or transformed before storage.
Automating Log Collection and Aggregation
In a DevOps environment, it is critical to automate log collection and aggregation across various systems, services, and platforms. Automation ensures that log data is consistently gathered and available for analysis without manual intervention.
Automating Log Collection and Aggregation:
- Centralized Log Collection:
- Using tools like Fluentd or Logstash, logs from various sources (e.g., servers, applications, containers) are automatically collected and sent to a centralized log repository.
- Centralization makes it easier to manage, search, and analyze logs from different systems, improving incident resolution and proactive monitoring.
- Log Aggregation Pipelines:
- In DevOps, log aggregation pipelines automate the process of collecting logs from multiple sources and transforming them into a standardized format.
- Tools like Logstash, Fluentd, or Filebeat can be used to process and aggregate logs, making it easier to parse and store the data in a centralized location like Elasticsearch or Splunk.
- Dynamic Log Configuration:
- Automated log configuration helps DevOps teams manage how logs are captured and stored based on dynamic system configurations.
- This is especially useful in containerized environments like Kubernetes, where logs from hundreds or thousands of containers need to be aggregated in real-time.
- Log Rotation and Retention:
- Automation can be used to set log retention policies, ensuring that logs are kept for a defined period and then rotated or deleted to free up storage.
- This ensures that log data remains manageable and that critical logs are always available for analysis.
Real-Time Log Analysis and Alerting
Real-time log analysis and alerting are key components of effective incident management and proactive monitoring in DevOps. By analyzing logs in real-time, teams can quickly detect anomalies, identify issues, and trigger automated responses.
Real-Time Log Analysis and Alerting:
- Real-Time Log Monitoring:
- DevOps tools like Prometheus and Grafana provide real-time monitoring of system and application logs, allowing teams to see how systems are performing at any given moment.
- Real-time analysis helps detect issues early and provides valuable data to prevent larger incidents.
- Threshold-Based Alerts:
- Alerts can be configured to notify DevOps teams when logs exceed certain thresholds (e.g., high error rates, slow response times, or system downtime).
- Alerts can be sent via email, SMS, or integrated with tools like PagerDuty, Opsgenie, or Slack to notify the team instantly when issues are detected.
- Anomaly Detection:
- Advanced log analysis tools like Splunk and Datadog can leverage machine learning algorithms to detect unusual patterns in logs and raise alerts for potential incidents.
- Anomaly detection helps teams identify issues that may not be immediately obvious from standard log data, improving the proactive response to incidents.
- Automated Incident Management:
- When an anomaly is detected, DevOps tools can automatically trigger workflows to resolve the issue, such as scaling resources, restarting services, or notifying on-call engineers.
- Automated incident management reduces response times and improves operational efficiency.
Continuous Improvement Through Log Analysis
Log analysis provides valuable insights that help drive continuous improvement in the DevOps pipeline. By continuously analyzing logs, teams can learn from past incidents, optimize processes, and enhance system reliability.
Continuous Improvement Strategies:
- Root Cause Analysis:
- After an incident, DevOps teams conduct a root cause analysis (RCA) to understand the underlying factors that contributed to the issue.
- Logs play a critical role in RCA by providing detailed information about the system’s state leading up to the incident.
- Post-Incident Reviews:
- Post-incident reviews are essential for identifying process improvements. Logs offer insights into what went wrong, what was missed, and how to avoid similar issues in the future.
- DevOps teams can use these insights to update monitoring configurations, alerting thresholds, and incident response protocols.
- Iterative Optimization:
- DevOps practices emphasize iterative improvements. By analyzing logs and using feedback from incidents, teams can continuously optimize their processes, systems, and monitoring configurations.
- Logs are an essential tool in this feedback loop, providing the data needed to refine practices and improve system performance over time.
- Performance Tuning:
- Logs provide detailed information about system performance, including bottlenecks, slow response times, and resource utilization.
- DevOps teams use this data to fine-tune infrastructure, applications, and services, ensuring better performance and reliability in future deployments.
Leveraging DevOps for Effective Log Analysis
Log analysis is an essential component of a successful DevOps strategy. By automating log collection, leveraging real-time analysis, and incorporating continuous improvement processes, organizations can improve system observability, proactively manage incidents, and optimize overall performance. With the right tools and practices, DevOps teams can turn log data into valuable insights that drive operational excellence and enhance system reliability.
Integrating log analysis into the DevOps pipeline not only helps in detecting and resolving issues faster but also contributes to a culture of continuous improvement and proactive problem-solving. As organizations grow and scale, DevOps-enabled log analysis will become even more crucial for maintaining high performance and meeting user expectations.