Upgrade & Secure Your Future with DevOps, SRE, DevSecOps, MLOps!
We spend hours on Instagram and YouTube and waste money on coffee and fast food, but won’t spend 30 minutes a day learning skills to boost our careers.
Master in DevOps, SRE, DevSecOps & MLOps!
Learn from Guru Rajesh Kumar and double your salary in just one year.
As organizations navigate the complexity of modern data infrastructure, Microsoft Fabric emerges as a revolutionary all-in-one analytics platform designed to unify data engineering, data warehousing, business intelligence, real-time analytics, and AI/ML—all under one SaaS umbrella.
Released in May 2023, Microsoft Fabric is built on top of Azure Data Lake and deeply integrated with Power BI, Azure Synapse, Azure Data Factory, and OneLake, offering a comprehensive, end-to-end data platform for enterprises.
🔍 What is Microsoft Fabric?
Microsoft Fabric is a cloud-native, unified data platform that brings together all the core capabilities required for a modern data stack:
- Data Factory (ETL/ELT)
- Synapse Data Engineering
- Synapse Data Science
- Synapse Real-Time Analytics
- Synapse Data Warehousing
- Power BI
- OneLake (a unified data lake storage)
Unlike traditional platforms that require integrating multiple tools, Fabric offers a software-as-a-service (SaaS) experience where all components work together natively, with centralized governance, AI assistance, and unified compute.
💡 Major Use Cases of Microsoft Fabric
1. Enterprise Data Warehousing
Unify structured and unstructured data into a scalable lakehouse architecture using Synapse Data Warehousing and OneLake.
2. Business Intelligence & Reporting
Power BI is natively embedded in Fabric, enabling seamless reporting and dashboarding directly on top of the data without replication.
3. Data Engineering Pipelines
Use Data Factory and Synapse Spark to create, schedule, and monitor robust data ingestion and transformation pipelines.
4. Real-Time Analytics
Leverage Synapse Real-Time Analytics to analyze streaming data from IoT devices, logs, or clickstreams with minimal latency.
5. AI/ML & Data Science
Fabric provides built-in notebooks (Python/Spark) and model training environments for building, training, and deploying ML models.
6. Data Governance & Security
Through Microsoft Purview integration, Fabric ensures end-to-end data lineage, compliance, and role-based access control.
🏗 How Microsoft Fabric Works (Architecture Overview)
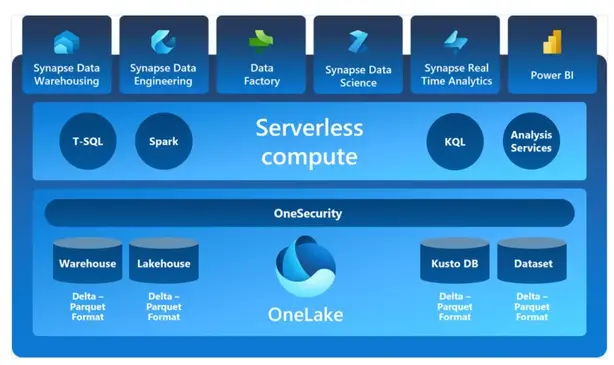
🔧 Fabric Architecture at a Glance
| Component | Purpose |
|---|---|
| OneLake | Centralized, multi-format data lake storage (like OneDrive for data) |
| Data Engineering (Spark) | Big data processing and batch transformations |
| Data Factory | Pipelines, ETL, data ingestion |
| Synapse Warehouse | Relational, structured query engine (T-SQL) |
| Synapse Real-Time | Low-latency analytics on streaming/semi-structured data |
| Data Science | Notebooks, ML models, AutoML |
| Power BI | Data visualization and dashboards |
| Copilot for Fabric | AI-driven code generation, insights, and query suggestions |
🔄 Fabric’s Engine
- Fabric runs on Lakehouse architecture, allowing both SQL and Spark to access the same data.
- Delta Parquet Format is used under the hood for optimized transactional storage.
- All workloads share access to OneLake, enabling zero-copy data sharing.
🔁 Basic Workflow of Microsoft Fabric
- Data Ingestion
- Load data from files, databases, SaaS sources using Data Factory pipelines or direct APIs.
- Storage in OneLake
- All ingested data is stored centrally in OneLake using Delta tables or Lakehouse structure.
- Data Transformation
- Use Spark or SQL to clean, join, enrich, and prepare data for analysis or modeling.
- Real-Time/Batch Processing
- Trigger scheduled jobs or respond to streaming data using Synapse Real-Time Analytics.
- AI/ML Modeling (Optional)
- Use notebooks and ML features to train models and deploy predictions.
- BI and Reporting
- Use Power BI to visualize results or publish reports to end-users.
- Governance & Monitoring
- Apply data policies, monitor performance, and audit activities using built-in tools.
🚀 Step-by-Step Getting Started Guide
📥 Step 1: Get Access to Microsoft Fabric
- Sign into Power BI Service
- Enable Microsoft Fabric Preview under Settings → Admin Portal → Tenant Settings → Microsoft Fabric
🧱 Step 2: Create a Workspace
- Go to Workspaces → Click + New Workspace
- Enable Microsoft Fabric Features for this workspace
🏞️ Step 3: Create a Lakehouse
- Within your Fabric workspace → Click + New → Select Lakehouse
- Upload files or ingest data using built-in connectors (e.g., Azure Blob, Dataverse, SQL)
🧪 Step 4: Create a Notebook
- From the same workspace → Click + New → Choose Notebook
- Write Spark/Python/SQL code for transformation, analytics, or ML
Example:
df = spark.read.format("delta").load("Tables/sales_data")
df.createOrReplaceTempView("sales")
result = spark.sql("SELECT region, SUM(amount) FROM sales GROUP BY region")
📊 Step 5: Build Power BI Reports
- Create or connect a Power BI Report from the Lakehouse or Warehouse
- Use AI-powered Copilot to generate visualizations or DAX calculations
⚙️ Step 6: Monitor and Automate
- Use Data Factory pipelines to automate ETL
- Schedule refreshes, alerts, and monitor usage through the Admin center